Introduction
A glass of iced milk coffee sells for IDR 25,000. The ingredients, coffee, milk, sugar, ice and packaging, may cost only IDR 5,000 to IDR 7,000. On that basis, the gross margin per cup looks remarkable: 70% to 80%. It is the kind of figure that makes many people think a cafe is a gold mine.
But there is a paradox that rarely gets discussed. Although the margin per cup looks fat, a cafe's net margin, meaning net profit after all costs, is actually very thin. Often it is only in single-digit percentages. Even large players with trillions of rupiah in revenue can post losses.
That is why the question "what is the ideal net margin for a cafe?" cannot be answered with a single number until you first understand where the large gap between a 70% gross margin and a net margin that is often below 10% goes. That gap is what decides whether a cafe survives.
This article breaks down a cafe's cost structure line by line, using real data from an Indonesian coffee company whose financial statements are public, highlights the costs that are often overlooked, and explains why the "ideal net margin" really depends on the format of the business and how honestly the numbers are calculated. From our experience supporting many kinds of companies, the gap between product margin and business margin is one of the things business owners misunderstand most often.
Note: most of the international comparison data in this article comes from global markets and serves as a reference, not as a fixed Indonesian standard. The figures in the case example are illustrative.
Evidence from real data: gross 61.7%, net 6.0%
Rather than theorise, let us look at real figures from an Indonesian coffee company whose financial statements are audited and open to the public.
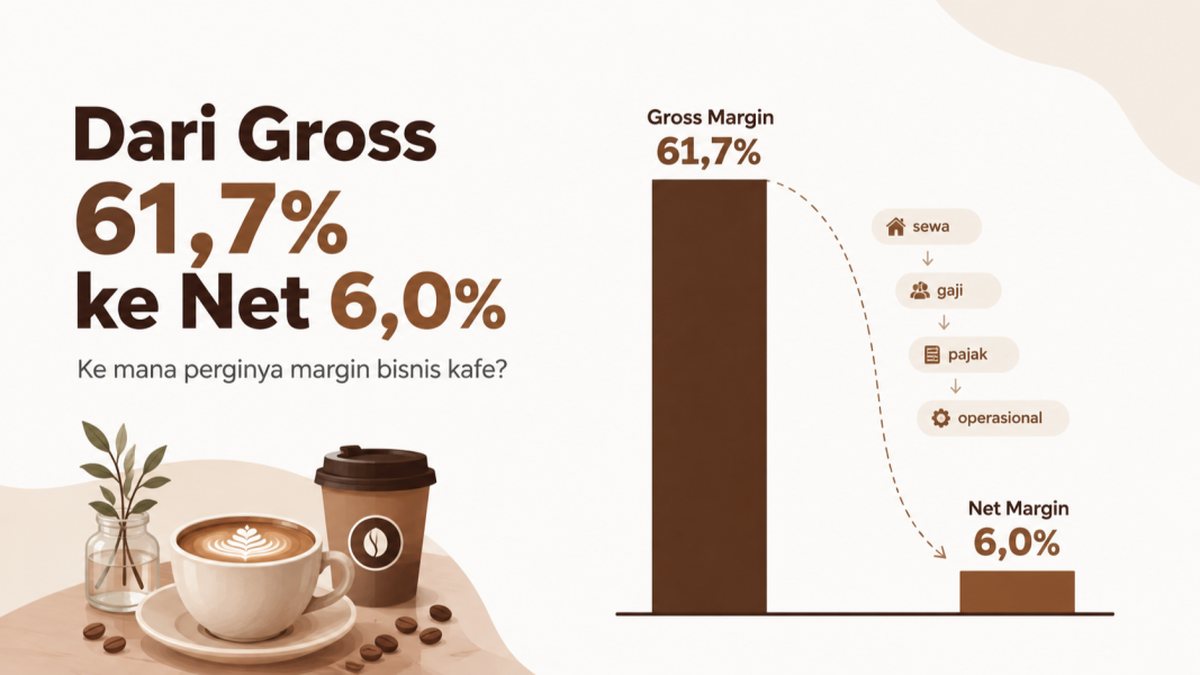
PT Fore Kopi Indonesia (FORE), a coffee chain listed on the Indonesia Stock Exchange, reported 2025 results that serve as a useful mirror. Revenue passed IDR 1.497 trillion, up 44.1% from the previous year. Its gross margin was a healthy 61.7%, consistent with a coffee business whose ingredient costs are relatively low compared with its selling prices.
But look at what happens next. From that 61.7% gross margin, the net margin ended up at only 6.0%: net profit of IDR 90.1 billion on revenue of IDR 1.497 trillion. In other words, out of every IDR 100,000 in sales, only about IDR 6,000 became net profit. The rest, around 54.7% of revenue, was absorbed by operating expenses: salaries, outlet rent, depreciation, and other general costs.
And FORE is not the worst case. It is actually one of the well-managed ones. Several other large players in Indonesia's F&B sector even recorded losses in the same period, despite revenue in the trillions of rupiah. Large scale, it turns out, is no guarantee of large profits.
The first lesson is clear: a high gross margin means nothing until you know what happens between gross and net. And that is where the whole story of a cafe's cost structure lies.
Breaking down the cost structure: where does 54% go?
The gap between gross margin and net margin is filled by operating expenses. For a cafe, these are dominated by three major line items, plus a series of costs that are often missed. Let us go through them one by one, with industry reference ranges for comparison.
Cost of goods sold (COGS): 15% to 35%. This is the direct cost of ingredients. The key point is that the figure differs greatly between drinks and food. Coffee drinks have a low beverage cost, around 15% to 25% of the selling price, so their gross margin is high. Food is the opposite: food cost runs at 28% to 35%, which is much heavier. This is why cafes that add many food items often see their percentage margin fall, even as revenue rises.
Labour: 20% to 35%. This is usually the second-largest line item, and often the one that squeezes hardest. For a cafe, wages for baristas and staff are set against the applicable UMP (provincial minimum wage), and in big cities that figure is not small. What is most often overlooked, however, is the additional burden on top of base salary: employer-paid BPJS contributions (Indonesia's state health and employment social security programmes), around 4% for BPJS Kesehatan (health) plus around 6.24% for BPJS Ketenagakerjaan (employment), as well as THR (the mandatory religious holiday allowance) of one month's salary per year. This means the real cost of an employee is higher than their monthly salary alone.
Rent: ideally below 10% to 15%. Rent is the most decisive line item and also the least flexible. Industry benchmarks are quite firm on this: healthy rent sits at around 10% to 15% of revenue, and once it goes above 15%, a cafe's profitability is immediately at risk. There is a useful rule of thumb: rent and labour combined should not exceed 45% to 50% of revenue. If the two already consume half of revenue, the room left for every other cost plus profit becomes very narrow.
Prime cost, the key figure that is often ignored. COGS and labour combined are called prime cost. The industry benchmark: a healthy prime cost is below 60% to 65% of revenue. Above that, a cafe faces a structural problem that is hard to offset through efficiency elsewhere. Prime cost is one of the first figures we check when assessing the health of an F&B business.
Costs that are often missed, and specific to Indonesia
This is where cafes in Indonesia face additional pressure that does not appear in international benchmarks. These costs are often left out of an owner's initial calculations, even though their impact on margin is real.
Restaurant tax (PB1 or PBJT, the regional tax on food and beverage sales): up to 10%. Under rules set by each region, restaurant tax can reach 10% of the sales value, and it applies in many major cities, including areas in Bali. By rule, this tax is charged to the consumer. In practice, however, many small cafes set "all-in" prices without separating out the tax, so this 10% ends up eroding their own margin.
Delivery platform commissions: 20% to 30%. For the share of sales that goes through delivery apps, platform commissions range from 20% to 30% of the transaction value, plus other charges. A cafe that makes most of its sales online can see a much thinner margin than on dine-in sales, even at the same selling price.
Payment transaction fees (QRIS MDR, the merchant discount rate on Indonesia's standard QR payment): 0.7%. For transactions through QRIS, there is an MDR of 0.7% borne by the merchant, which by regulation may not be passed on to the consumer. It is small per transaction, but it adds up at high volume.
Income tax. For businesses with turnover below IDR 4.8 billion per year, PPh Final (final income tax) of 0.5% of turnover applies. Above that threshold, the business moves into a different tax regime. This line item must be part of the calculation from the start.
When all these Indonesia-specific costs are added to the three major line items above, it becomes clear why a cafe's net margin is so thin. The drop from 60% gross to 6% net is not caused by one big cost, but by the accumulation of many costs that each look small.
Why the "ideal net margin" is not a single number
If you look for one definitive figure for the "ideal cafe net margin", you will find confusing answers, because even credible sources differ. That difference is important to understand, not to hide.
Some of the different benchmarks:
- Industry sources such as IBISWorld put cafe net margin at around 4% to 5%.
- Another analysis based on census data puts it at 2.5% to 7%.
- A survey of established independent cafes gives a higher figure, averaging around 13.8%.
- An academic study of micro coffee shops in Yogyakarta even found figures of 22% to 26%.
- The strongest proxy from an Indonesian listed company, FORE, sits at 6.0%.
Why is the range so wide, from 2.5% to 26%? There are three main reasons.
First, the sample populations differ. Low figures such as IBISWorld's cover all operators, including those that are failing or struggling, which pulls the average down. High figures such as the 13.8% survey cover only cafes that are established and have survived, because those that failed have already closed and are not included in the survey.
Second, the scale differs. A micro cafe run by its owner has a different cost structure from a large chain with corporate overhead.
Third, and most misleading of all, whether the owner's salary is counted. The micro cafe study showing margins of 22% to 26% most likely did not deduct a salary for the owner working full time in the cafe. If the owner's time and effort were counted as a cost, the real margin would be much lower. This is a classic mistake: feeling very profitable, when in fact you are paying yourself below a fair wage without realising it.
So the honest answer is this: for a professionally managed cafe with all costs fully accounted for, a net margin in the single digits to the low teens is realistic. Anything above that deserves suspicion, as some costs may not have been counted.
Case illustration: a cafe that feels profitable but runs on thin margins
This case example is illustrative and does not represent any specific client engagement. Figures are simplified.
Imagine a cafe with revenue of IDR 100 million per month. The owner believes the business is healthy, because the gross margin per cup looks large. Let us break down the P&L, starting from revenue at 100% and working down.
Revenue: 100%. COGS (a mix of drinks and food): 30%, leaving a gross margin of 70%. So far it looks excellent.
Then operating expenses start to bite. Labour including BPJS and the THR accrual: 28%. Rent, because the cafe is in a busy location with high rent: 18%, already above the 15% safe threshold. Utilities, including electricity for an espresso machine that runs all day, plus internet and others: 12%. Marketing and other costs: 8%.
At this point, total costs already come to 30% + 28% + 18% + 12% + 8% = 96%. That leaves 4%.
But it does not end there. The cafe sets all-in prices without separating out restaurant tax, so PB1 eats into part of the margin. Part of its sales go through delivery platforms with high commissions. There is the QRIS MDR and PPh Final. After all of this, the 4% margin can shrink to close to zero, or even turn negative in a quiet month.
What is striking is that the owner felt profitable the whole time, because they were looking at the 70% gross margin per cup. They did not realise that 18% rent and an accumulation of small costs had eaten almost all of the margin. The problem was not sales or the price per cup, but a cost structure that had never been broken down in full.
Had the owner moved to a location with more reasonable rent (down from 18% to 12%), separated tax from the price, or rebalanced the share of online sales, those few percentage points could have made the difference between barely breaking even and a genuinely healthy margin.
How to read these numbers for your cafe
A few practical principles for using the benchmarks above:
Break your margin down all the way to net; do not stop at gross. A high gross margin per cup is a psychological trap. What determines whether your business is healthy is the net margin after all costs, including the ones that are often missed.
Calculate your prime cost first. Add up COGS and labour. If the total is already above 60% to 65% of revenue, that signals a structural problem that needs to be addressed before anything else.
Treat rent as a margin decision, not just a location cost. Rent above 15% of revenue is a warning sign. A busy location that demands high rent is not necessarily more profitable than a quieter location with reasonable rent.
Include all Indonesia-specific costs from the start. PB1, platform commissions, MDR and income tax should be in your model from day one, not a surprise at the end of the month.
Count your own salary as a cost. If you work full time in your cafe, your time has value. A margin that looks healthy but ignores the owner's salary is an illusory margin.
Watch the trend, not a single month's figure. As with all financial metrics, the direction of your margin over time is far more informative than one month's figure in isolation.
Closing
The cafe business holds a paradox that traps many owners: a fat margin per cup creates the illusion of a highly profitable business, while the actual net margin is often thin and fragile. Real data confirms this. Even a coffee chain as large as FORE, professionally managed with revenue in the trillions, posted a net margin of only 6%.
The "ideal net margin for a cafe" is therefore not a question that can be answered with one magic number. The honest answer is: single digits to the low teens for a business that counts all its costs honestly, and that figure is determined entirely by how disciplined you are in managing the three major line items, COGS, labour and rent, and how carefully you account for the small costs that are easy to miss.
The good news is that all of this can be calculated and managed. The gap from gross to net is not a mystery, but a list of line items that can be broken down, measured and improved one by one. What is needed is not a higher price per cup, but a complete understanding of the cost structure.
A healthy business is not only one that makes a profit, but one that understands its numbers, controls its risks, and moves in a clear direction.
References
- Financial performance of PT Fore Kopi Indonesia (FORE) FY2025: revenue IDR 1.497 trillion, gross margin 61.7%, net margin 6.0%, net profit IDR 90.1 billion, COGS 38.3%. FORE 2025 Financial Statements and Annual Report, as reported by the Indonesia Stock Exchange and covered by Databoks, Investor.id, Kontan and Bloomberg Technoz.
- Performance of other listed F&B companies (losses at several large players in the F&B sector). Each company's public financial statements on the Indonesia Stock Exchange.
- Benchmark ranges for cafe net margin, COGS, labour and rent. A compilation of international industry benchmarks (IBISWorld, National Restaurant Association, VantaInsights and surveys of independent cafes), serving as a reference for the global context. Academic study of micro coffee shops in Yogyakarta (Jurnal INSTIPER, 2026) for the Indonesian micro-scale context.
- Indonesia-specific tax and cost rules: PB1/PBJT up to 10% (UU HKPD, the law on central and regional fiscal relations, and regional regulations), QRIS MDR 0.7% (Bank Indonesia), PPh Final 0.5% and the PKP (VAT-registered business) threshold of IDR 4.8 billion (PP 55/2022 in conjunction with PP 20/2026), employer BPJS contributions (related Presidential and Government Regulations), delivery platform commissions (each platform's terms).
Most margin benchmarks come from global markets and are for reference, not Indonesian standards. Official Indonesian data for some metrics (such as cafe failure rates and average transaction value) is not yet available from official statistical sources, so it is not claimed in this article. Case example figures are illustrative. Tax rules and rates may change; please verify against current regulations and with your tax consultant.