Introduction
When an employee resigns, most companies measure the cost by one visible item: the cost of posting a job ad and recruiting a replacement. The figure feels small, so the departure is treated as business as usual.
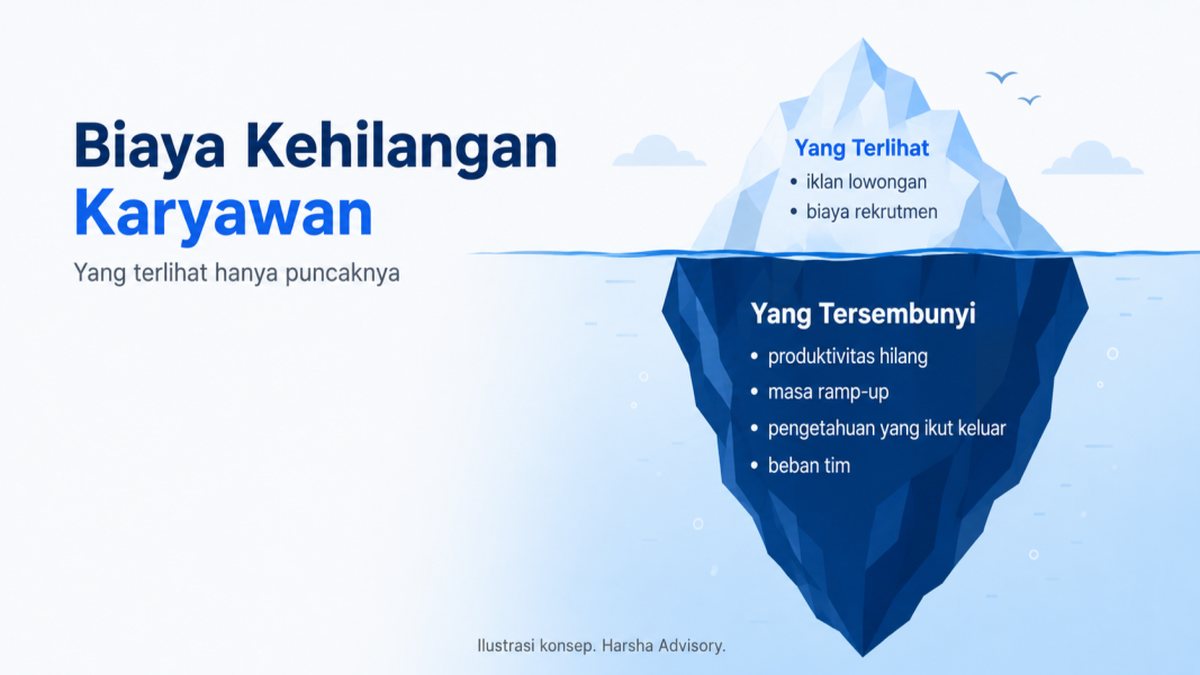
Yet the cost of a job ad is only the tip of the iceberg. The real cost of losing one employee runs much deeper, and most of it never appears in any financial statement. It is hidden in lost productivity, wasted time, knowledge that walks out the door, and the extra workload carried by the team left behind.
International research shows a striking figure: replacing one employee can cost half to twice their annual salary. For a company, the accumulated cost of turnover over a year can easily reach hundreds of millions to billions of rupiah, mostly without anyone noticing.
This article breaks down the cost of turnover item by item, using benchmarks from credible research institutions, shows why the most expensive part is the one you cannot see, and closes with one root cause that is often overlooked but can be managed. In our experience supporting many kinds of companies, turnover is one of the biggest cost leaks and one of the least often measured.
Note: the cost benchmarks in this article come from international research (mainly from the United States) and serve as a reference, not an established Indonesian standard. We have not yet found a credible and comprehensive national benchmark for turnover costs in Indonesia. Rupiah figures are illustrative to show scale.
How big are the numbers
Let's start with the benchmarks most often cited in human resources research.
According to Gallup, the cost of replacing one employee ranges from half to twice their annual salary, and Gallup itself describes this as a conservative estimate. Gallup also estimates that voluntary turnover costs businesses in the United States around one trillion dollars a year.
The figure varies by job level. Gallup breaks it down: replacing a frontline worker costs around 40% of annual salary, a professional or technical employee around 80%, and a manager or leader can reach 200%. The more senior and specialised a role, the more expensive it is to lose, because these people carry more knowledge and relationships, and their successors need longer to reach full productivity.
SHRM, the world's largest HR professional association, highlights that direct recruitment costs alone already average thousands of dollars per position, and that does not include the far larger indirect costs. Meanwhile, Work Institute, based on an analysis of more than one hundred thousand exit interviews, gives the most conservative estimate at around 33% of annual salary.
Notice that all these sources, despite their different figures, point in the same direction: the cost of turnover is far greater than recruitment costs alone. And what makes it so large is the invisible component.
Breaking down the components: why the most expensive part is invisible
The cost of turnover falls into two parts: the visible and the hidden. The visible part is easy to calculate. The hidden part is much larger.
Direct costs (visible). These include the cost of posting job ads, time spent screening and interviewing candidates, background checks and recruitment administration. SHRM estimates average direct recruitment costs at around 4,700 dollars per position. Add to that the cost of onboarding and training the new hire. This is the part that usually makes it into the budget, and because it is visible, it is often mistaken for the whole cost.
Lost productivity while the position is vacant. While the seat is empty, the work that should be done produces nothing. Output is delayed, targets slip, and part of the workload falls on teammates. This cost does not appear on any invoice, but it is real.
The new hire's ramp-up period. A new employee is not fully productive on day one. There is an adjustment period until they truly master the role, and it tends to be longer for more senior or technical positions. During that time, the company pays a full salary for productivity that is not yet full.
Loss of institutional knowledge. This is the hardest to calculate and also the most expensive. A departing employee takes with them knowledge that was never documented: how to handle certain customers, the context behind past decisions, shortcuts only they knew, relationships they built. All of this leaves with them, and their replacement has to build it from scratch.
The burden on the team left behind. When one person leaves, their team carries the extra load until a replacement arrives and becomes productive. This leads to overtime, exhaustion and, in the worst case, a chain of resignations. One departure that is not handled well can trigger the next.
Many HR practitioners and studies stress that these indirect costs are often greater than the visible recruitment costs, even though they are harder to measure precisely. That is why companies that only count the cost of job ads risk seriously underestimating how much turnover really costs them.
An illustration in rupiah
Because the benchmarks above are based on international research, let's translate them into the context of Indonesian salaries to show the scale. To be clear, the following figures are illustrative, applying global benchmarks to local salaries, and are not Indonesian cost data.
A staff member earning IDR 10 million a month (IDR 120 million a year). Using Work Institute's conservative benchmark (33%), the cost of replacing them is around IDR 39.6 million. Using Gallup's range, it is IDR 60 million at 50%, and IDR 96 million if the role is technical (80%). At the upper end, the replacement cost can reach IDR 240 million. For a single staff member.
A manager earning IDR 25 million a month (IDR 300 million a year). Using Gallup's range, it is IDR 150 million at 50%, and with Gallup's benchmark for the manager or leader level (200%), it can reach IDR 600 million. In other words, one manager leaving can cost more than half a billion rupiah.
At company scale. Imagine a company with 120 employees and a turnover rate of 15% a year, meaning around 18 people leave each year, with an average salary of IDR 120 million a year. On the most conservative assumption (33%), the total annual cost of turnover is already around IDR 712.8 million. At Gallup's lower bound (50%), it becomes around IDR 1.08 billion. At the midpoint (100%), it exceeds IDR 2.16 billion a year.
Even on the most cautious assumption, the annual turnover cost of a company this size easily reaches hundreds of millions to billions of rupiah. This is not a small cost to be ignored, but a leak equivalent to a major budget line.
Most of it can be prevented
There is one finding that changes how you look at this whole issue: most turnover can actually be prevented.
Gallup found that 42% of employees who left voluntarily said their manager or organisation could have done something to prevent them from leaving. In another study, Gallup even recorded that 52% of departing employees said their manager or company could have prevented it, and more than half said no one had spoken to them about their job satisfaction or future at work in the three months before they left.
This means turnover is not fate. It is largely the result of things that can be addressed: conversations that did not happen, development that was not offered, and pressure that went unnoticed. And because replacement costs are so high, preventing even a few departures a year can save hundreds of millions of rupiah. Retention, in other words, is not a cost. It is an investment with a measurable return.
An often overlooked factor: employees' financial stress
Among the many preventable causes of turnover, there is one that rarely appears on HR's radar, even though its link to retention shows up fairly consistently in research: employees' financial stress.
PwC research shows that financially stressed employees are twice as likely to look for a new job as those who are not (36% versus 18%). The same research found that 73% of employees said they would be more attracted to an employer that cares more about their financial wellbeing. This is an association, not direct cause and effect, but the pattern is consistent enough to deserve attention.
The logic makes sense. Employees under financial pressure are more easily tempted by an offer of slightly higher pay, even if the difference is small, because every rupiah feels urgent. They also bring that anxiety to work, which erodes focus and engagement, two things that in turn speed up the decision to leave.
This is where an often overlooked opportunity appears. Helping employees feel more financially secure, through financial education or financial wellbeing programmes, is one approach worth considering in a retention strategy. It addresses a side that is rarely dealt with, at a cost that is generally far smaller than the cost of losing and replacing employees who leave.
What you can do
A few practical steps to manage the cost of turnover.
Measure your own numbers first. Calculate your actual turnover rate and the cost per departure, covering direct costs (recruitment, onboarding, training) and indirect costs (lost productivity, ramp-up, manager time, team overtime). International benchmarks are useful as a starting point, but your own numbers are what should drive decisions.
Prioritise retaining senior and specialist roles. Because their replacement cost can reach twice their annual salary, keeping one key manager is equivalent to saving hundreds of millions of rupiah.
Focus on preventable causes. Regular conversations between managers and employees, clear career paths and meaningful recognition are low-cost levers with a high retention impact.
Treat employees' financial stress as a business issue. Given that financial stress is linked to a higher tendency to look for a new job, employee financial education or wellbeing programmes are worth considering, especially since their cost is relatively small compared with the cost of losing employees.
Treat turnover as a cash metric, not just an HR metric. If your annual turnover rate is high or concentrated among your best employees, treat it as a priority cost leak that deserves leadership attention, not just a number in an HR report.
Closing
Losing one employee rarely feels like a big event. One person leaves, a vacancy is opened, a replacement is found. But behind that seemingly routine process is a cost far larger than it appears: lost productivity, departing knowledge, an overloaded team, and months before everything returns to normal.
The good news is that most of this cost can be calculated, and most turnover can be prevented. What it takes is to stop viewing turnover as an administrative matter and start seeing it for what it is: one of the biggest and least measured cost leaks, and at the same time one of the most manageable.
A healthy business is not just one that makes a profit, but one that understands its numbers, controls its risks, and moves with a clear direction.
References
- The cost of replacing an employee at 50% to 200% of annual salary, broken down by level (frontline ~40%, technical ~80%, manager ~200%), voluntary turnover costing US businesses ~USD 1 trillion a year, and 52% of departing employees saying their departure could have been prevented. Gallup, "This Fixable Problem Costs U.S. Businesses $1 Trillion" and "42% of Employee Turnover Is Preventable but Often Ignored" (2024).
- Average direct recruitment cost of ~USD 4,700 per position, and far larger indirect costs. SHRM (Society for Human Resource Management), "The Real Costs of Recruitment".
- A conservative estimate of turnover cost at ~33% of annual salary. Work Institute, Retention Report (based on an analysis of more than 100,000 exit interviews).
- Financially stressed employees are twice as likely to look for a new job (36% versus 18%), and 73% are more attracted to an employer that cares about their financial wellbeing. PwC, Employee Financial Wellness Survey.
- Indonesian context: Indonesia's attrition rate (not cost) of 15.9% (2022) and 15.1% (2023). Aon, Salary Increase and Turnover Study for Southeast Asia.
The cost benchmarks in this article come from international research (mainly the US) and serve as a global reference, not an Indonesian standard. We have not yet found a credible and comprehensive national benchmark for turnover costs in Indonesia from official statistical sources, so none is claimed in this article. For Indonesia, what is available is attrition rate data, not cost data. Rupiah figures are illustrative to show scale. Rules and data can change; please verify with the latest sources.